Getting Started with CA Web
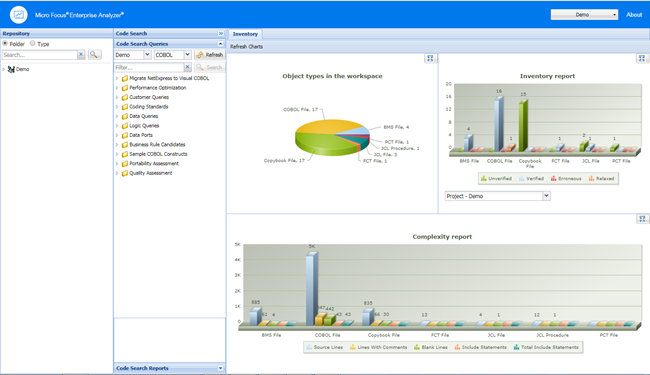
The starting page of CA Web consists of a few different sections - a banner, Repository pane, Code Search pane and results pane with the Inventory tab displayed in it.

Banner
Click About to see the CA Web version number.
The button in the top right shows the name of the current workspace. You can change the workspace by clicking this button and selecting a workspace from the list.
The choices you have depend on what workspaces you have configured from in the COBOL Analyzer Administration.
Repository Pane
The Repository pane shows the contents of the repository for the current workspace. It has two views that you can switch between using the radio buttons:
- Folder
- Displays the contents of the repository in the same folder structure as the one they have in the host environment. This allows for elements with the same name (homonyms) to be loaded and displayed.
- Type
- Displays the contents of the repository by project, object type, and object relationship.
Each of the two tabs consists of the following elements:
- Browser
- Shows the objects in the repository of the current workspace in a tree structure. Depending on the tab you have selected in the Repository pane, the contents are displayed either by type or by folder.
- Search
- Lets you execute various searches in the repository of the current workspace.
To expand a node in the Repository pane tree, click
 . By drilling down the nodes you can easily find programs called by or called to, copybooks used, data accessed, etc.. These
elements are different depending on the element chosen. They are all relationships at object level between programs, files,
database tables, copybooks,
etc.
Double-click an object and the source code will display in the pane on the right as a new tab alongside Inventory.
- Query Repository
- Shows all the queries available for the selected type of source.
- Related Java Packages
- Boundary Points (potential) - Points that could lead to requests resources outside of Java
- Boundary Points (resolved) - Points that lead to requests resources outside of Java
- Is Invoked By
- Related Java Files
- Dependent Sources
- Direct References (outgoing)
- Direct References (incoming) - This makes references to usage directly. A program is called through a Program Entry Point so this won't return the list of Called Programs, but the includes and copies.
- Is Called By
- Is CRUD By
- Used Data Stores
- Used Sources
- Diagrammer
- Creates a small graph. The information on the graph depends on the requested type of graph. For example, Call Map will show all the links between programs.
- the following table displays the Diagrammer scopes:
Call Map Program to program calls CICS Flow Interactions between transactions, programs, and screens Job Flow Process to program to data port to data store Screen Flow Program to screen send/receive AS/400 Flow DBFile links Data Flow Program to data IMS Flow Interactions between transactions, programs, screens and segments. Job Executive Report Job to program, sys-program and data store Natural Flow Natural links between programs, screens, etc. Program Executive Report All links coming from a program Source Dependencies Links between sources (copies, includes, etc.) Unisys Flow Unisys links - Open
- Opens the source file.
Code Search
From the Code Search pane you can execute queries. By default, the queries are the same as in COBOL Analyzer but you can create your own queries in the tool and add them to the Code Search tab.
In this pane you have two different views: Code Search Queries and Code Search Reports. From Code Search Queries you can execute queries defined in Code Search in CA and from Code Search Reports you can execute pre-defined reports such as QA report, coding standards report, migration assessment, etc.
From the top left dropdown list you can choose the project that you want to use as the scope for the Code Search Query.
The dropdown list next to it lets you choose the language of the sources.
Click Refresh to update the list depending on your choices.
Filter lets you search in the list of queries. You can then use the Search button to execute the query, or you can right-click a query and then select Search. All queries results appear in the Inventory pane.
Results Pane
When you start CA Web, this pane displays the Inventory tab with three different types of charts:
- Object types in the workspace - the types and number of elements in the workspace.
- Inventory report - the verification results for each type of element.
- Complexity report.
When you execute a query, the results from it appear in this pane as a new tab named after the query.
Doubleclick an element to see its source code. It will appear in a new view in this pane.
Doubleclick a result of a query to open the source code with the cursor on the corresponding line.
You can also right-click a variable and create an "Impact trace" for the variable. The impact trace will show you how the data flows to and from other variables, files, screens etc.