Viewing the Code Coverage Information
Running an application with code coverage produces a .tcz report file. Enterprise Developer uses the information in this file to provide statistics in the Code Coverage view about what percentage of the code has been executed as well as to colorize the code in the editor to indicate covered (executed) and missed (not executed) blocks as well as covered and unexecuted programs.
From the Code Coverage view, you can navigate to the covered and missed blocks of code in the editor, import code coverage data from existing .tcz files or merge the report files produced from different runs of the application, and relaunch the application in code coverage mode.
Code coverage statistics
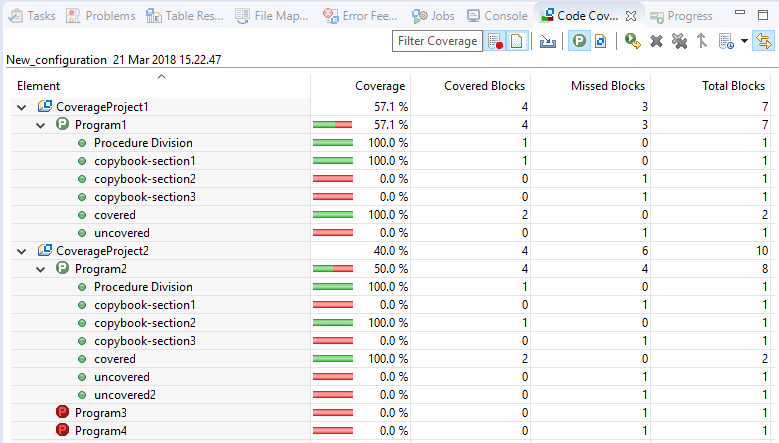
After executing an application with code coverage, the IDE automatically opens the Code Coverage view to display the code coverage information. (If the view is not visible, to display it click Window > Show View (or Show View > Other), expand Micro Focus, click Code Coverage, then click OK).
The view visualizes the code coverage information from the filename.tcz results file produced during the latest run with code coverage. The code coverage information can be displayed in two different views:
- Coverage per Programs (
 )
)
- Coverage per Files (
 )
)
By default, the coverage per programs view is displayed. It displays the paragraphs and the sections within the program and what percentage of the code has been covered in the context of blocks:

To change to the file view, click
 (Coverage per Files). This view displays a list of files (both programs and copybooks) with their percentage of code which
has been covered in the context of statements:

Covered and missed blocks
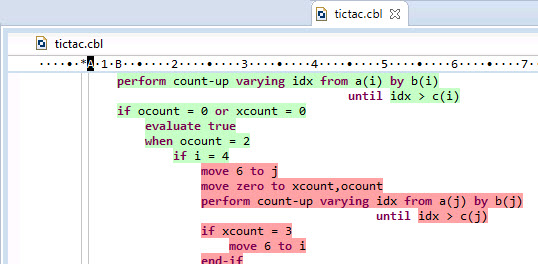
To view the covered and missed blocks, either scroll down the code of a COBOL program or double-click the lines of the program's structure in the Code Coverage view:

By default, covered code is green, covered code in a global context is blue, and code not covered is red. You can specify your color preferences for the colorization of covered and missed blocks as follows:
- In the IDE, click Window > Preferences > General > Editors > Text Editors > Annotations.
- Specify your preferences for the Covered Block, Covered Block in Global Context, and Missed Block items in the Annotation types list.
Editing the code after producing coverage results
The information displayed in the Code Coverage view and the colorization of the editor reflect the state of the application at the time it was executed to produce that specific coverage results file. If you then make a change in the code and compile it, this might move the code in the editor. As a result, the colorization in the editor might not accurately match the information displayed in the Code Coverage view. The data displayed in the Code Coverage View will still reflect the historical state of the program when the data was generated.
Other situations where the colorization in the editor might not accurately represent the information in the code coverage view include:
- The results from running with code coverage are accumulated in a single results file (Accumulate data successive runs is enabled on the Dynamic Analysis tab in the application's launch configuration).
- When loading a merged results file that includes the data from different runs with code coverage.
- When loading a results file from running the application with code coverage before you changed the code.
Importing existing code coverage results
To import the code coverage information from an existing .tcz results file:
- In the
Code Coverage view, click
 (Import Session).
- Use the Connection list to specify whether the file is on your local disk or on a remote machine.
- Navigate to and select an existing code coverage report
.tcz file, then click
OK.
This imports the code coverage statistics from the .tcz file into the Code Coverage view and adds colorization to your source files indicating the missed and the covered blocks.
Situations in which this behavior might occur are:
- You have checked the Accumulate data successive runs checkbox on the Dynamic Analysis tab in the launch configuration which you use for running the application.
- If you have merged multiple results files available in the code coverage history and the program has changed the different runs with code coverage that produced code coverage data.
- If you have selected to load and display the results from running the application with code coverage before you changed your program.
Also, when importing code coverage results for remote projects that no longer belong to your workspace, unexecuted programs are no longer displayed in the results.
Rerunning the application with code coverage
After making changes to your application, to rerun the application with code coverage results:
- In the
Code Coverage view, click
 (Relaunch).
This starts the application.
- Run and then exit the application to produce new code coverage results.
Deleting code coverage results
To delete the coverage results currently displayed in the Code Coverage view:
- In the
Code Coverage view, click
 (Remove Current Coverage Results).
To delete all code coverage results:
- In the
Code Coverage view, click
 (Remove All Coverage Results).
Merging the code coverage results from different runs
You can merge the results file from different executions with code coverage. This provides combined statistics of running the application in different scenarios. To merge the results:
- In the
Code Coverage view, click
 (Merge History Items).
- In the
Code Coverage Merge History Items dialog box, check the results files you want to merge, specify a name for the new results file, then click
OK.
This creates a new results file that includes the combined statistics and opens it in the Code Coverage view.
Viewing previous code coverage results
Enterprise Developer preserves the history of the previous results of running the application with code coverage.
Click
 (Manage History) to view and load the statistics from previous runs with code coverage, to remove previous results, or to configure how many
items are preserved in the history.
Showing unexecuted programs
The
Code Coverage view displays information about any programs that were not executed. Click
 (Show Unexecuted Program Information) to toggle the display of unexecuted programs.
Showing files with no statements
When in the coverage per files view, you can filter out files from the display list that do not contain statements that are
covered. To filter files, click
 (Show Files with no Statements) to toggle the display of files containing no statements. By default, filtering is not applied.
Link code coverage with editor
By default, the code coverage is linked with the editor. Double-click the element in the
Code Coverage tab to open the file in the appropriate editor. Click
 (Link with Editor) to toggle the link between the
Code Coverage tab and the editor.
Filtering views by search strings
To filter the rows displayed in either view, type a string in the search filter field in the Code Coverage tab. You can use the "?" wildcard character to match a single character and the "*" to match any number of characters. By default, no filtering is applied.