Tracing Functions
The Debug menu's Trace Option commands generate output messages that describe operations performed in a given domain during program execution. You can invoke the various trace functions only through the Debug menu's Trace Option commands. Each function is described briefly below. More information about trace functions can be found in section Runtime Debugger of the ACUCOBOL-GT User's Guide.
Trace File toggles file tracing on and off. Output trace information includes all file-related operations performed at runtime. Trace level for this command can be set from 1 to 10 via the Trace Level dialog box described below.
Trace Paragraphs toggles paragraph tracing on and off. Output trace information includes all paragraphs and sections entered at runtime.
Trace Screens toggles screen tracing on and off. Trace output includes information about DISPLAYs of Screen section items and about CREATEs, DISPLAYs, MODIFYs, and INQUIREs of ActiveX objects. Trace level for this command can be set from 1 to 10 via the Trace Level dialog box described below.
Trace Flush toggles trace flushing on and off if you are writing to an error file. With this command, the error file is flushed to disk after each WRITE operation.
Trace General toggles general tracing on and off. Trace output includes information on operations not covered by either the Trace File or Trace Screens command. Trace level for this command can be set from 1 to 10 via the Trace Level dialog box described below.
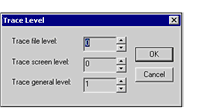
Trace Levels displays the Trace Level dialog box, in which you can set the level of detail in the output messages generated.

Trace levels can be set for the Trace File, Trace Screens, and Trace General commands. The higher the trace level, the greater the amount of debugging information sent to the error file. Therefore, an entry of 10 generates maximum output and an entry of 1 generates minimum output. An entry of 0 (the default) generates no output. The extra information is useful primarily to the extend Technical Support department.
To designate an error file to receive trace level output, select the File to be opened for error message (-e) option in the Project Settings > Runtime > I/O options dialog box. Indicate the name of the error file in the adjacent entry field. Note that if you set a trace level of 10, and see no output, this can mean that program execution included no output triggers.
Trace to Debug Window toggles the display of trace output messages in the Output window. The trace information displayed may be the result of any trace command except Trace Levels. You should establish an error file before you use this command. See Debugger Output for information about directing output to an error file.