2.1 Integrating Filr Apliances with Prometheus and Grafana on Filr 24.1 Server
Install Prometheus on one Filr 24.1or SLES 15 SP4 server which acts as the Prometheus server and install node exporter on the Filr Appliance to be monitored for collecting statistics like CPU, memory, and disk space utilization.
Figure 2-2 Filr Server Integration
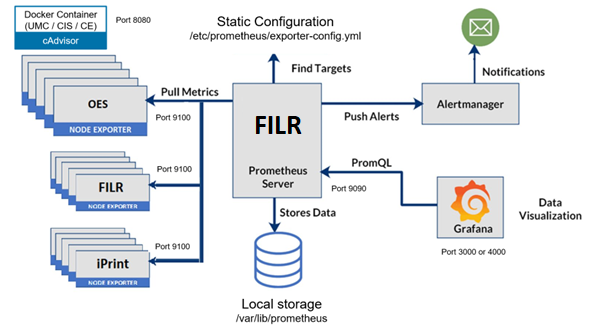
In the default Prometheus server configuration file, a job is added to scrape metrics from all the target servers. Prometheus can store pulled matrices in its default path, or it can use another volume to store the data.
Alertmanager and Grafana can co-exist on the same Prometheus server or on a standalone server. In the alertmanager configuration file, rules are added to trigger alerts based on specific conditions. Email is one such notification sent to the respective target when the condition is met.