3.3 Installing Grafana on the Prometheus (Monitoring) Server
There are several ways to install Grafana, including as a Docker container. However, we will use the rpm-based setup because it is less complicated.
-
Download the Grafana RPM from the Grafana download site.
wget https://dl.grafana.com/oss/release/grafana-9.4.7-1.x86_64.rpm
-
Install Grafana.
rpm -i --nodeps grafana-9.4.7-1.x86_64.rpm
-
Modify the Grafana configuration file located at /etc/grafana/grafana.ini to set the default port.
########### Server ##########;
[server]
# Protocol (http, https, h2, socket)
protocol=http

# The ip address to bind to, empty will bind to all interfaces
;http_addr =

# The http port to use
http_port = 3000
NOTE:To access with https, you can follow this steps mentioned here.
-
Start the Grafana Service.
systemctl start grafana-server.service
3.3.1 Configuring the Grafana dashboard
Prerequisites:
Before configuring the Grafana dashboard for Node Exporter ensure to integrate the Metric Endpoints. See,Section 4.0, How to Integrate Metric Endpoints (targets).
-
Login to http://<server_ip_of grafana>:3000 with default user credentials (admin/admin).
-
Add the Prometheus data source to Grafana:
-
Navigate to in the Grafana sidebar.
-
Select as the type.
-
Set the appropriate Prometheus server URL (for example, http://localhost:9091/).
-
Adjust other data source settings as required (for example, choosing the right access method).
-
Click to save the new data source.
NOTE:In case of failure, ensure the service is up and running and that the correct port number has been added to the firewall.
-
-
Go to the Grafana Community where you can find numerous ready-made dashboards that can be imported and utilized in your environment.
NOTE:Grafana dashboard provides different templates for Node Exporter.
-
Select the required ready-made dashboards from and copy the ID of the dashboard.
-
Import the dashboard using the available template in Grafana labs.
-
Navigate to in the Grafana sidebar.
-
In field, enter the copied ID of the ready-made dashboard, we recommend 1860 and click .
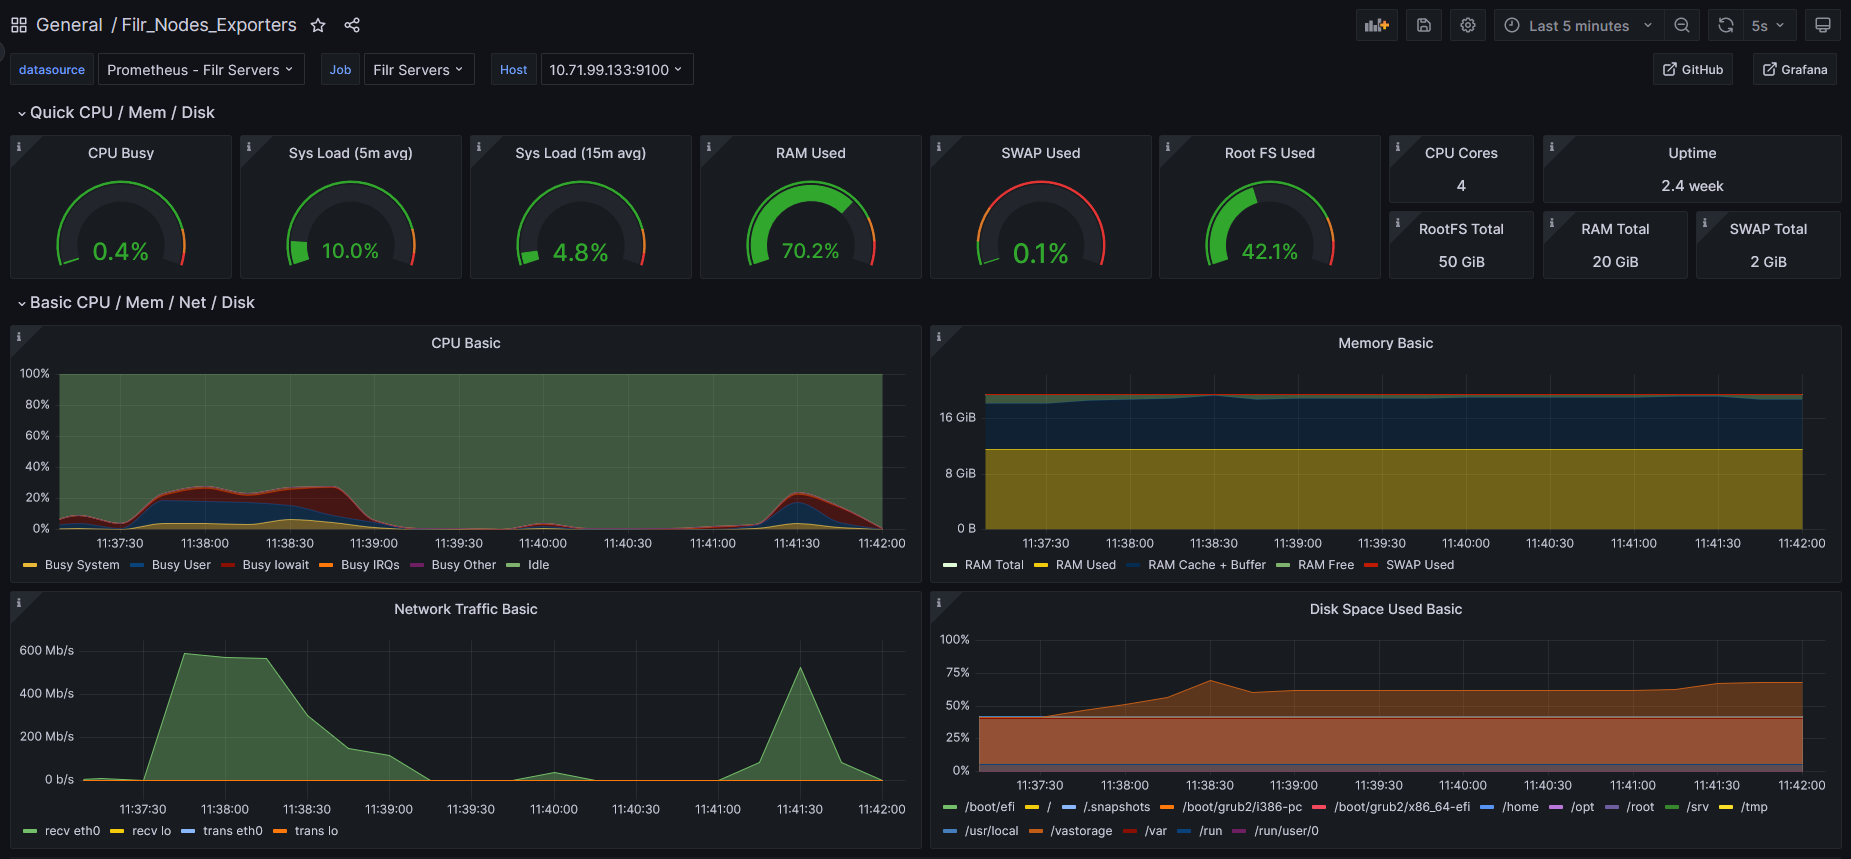
Figure 3-1 Grafana Dashboard
-
From drop-down list, select the server for viewing the respective dashboard results.
NOTE:Logs and dashboard data are getting stored in /var partition.
-
So, recommended to have enough storage size.
NOTE:Logs and dashboard data are being stored in /var partition. Hence,it is recommended to have enough storage size.
-