Tracking Cumulative Flow
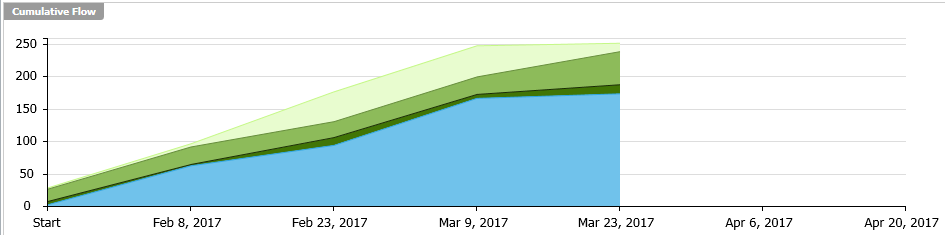
The TRACKING Cumulative Flow chart represents the amount of work in the Release in different states for each Sprint of the Release. The vertical axis represents the total number of Points or Stories in the Sprint (depending on whether the release was planned and tracked with Points or Stories). The horizontal axis represents each Sprint of the Release. It includes Points Not Started (light green), Points In Progress (green), Points Completed (dark green), and Points Accepted (blue). The height of the chart defines the scope. If something is added or the estimate is increased, then the whole chart gets taller. If something is removed or the estimate decreased, then the chart gets smaller. It provides the ability to see changes in scope in the Release.