Tutorial: Creating a Native COBOL Application
Overview
This tutorial introduces the Visual Studio Integrated Development Environment, shows how to create and build a native COBOL console application, and demonstrates some of the features you can use when debugging native code. You are going to:
- Create a solution and a project that contains a COBOL program
- Build and run the application
- Debug the application
You must have both Microsoft Visual Studio and Visual COBOL installed.
Starting Visual COBOL
To start Visual COBOL:
- Depending on your Windows version, do one of the following:
- Windows 7 and Earlier
-
- From your desktop, click Start > All Programs > Micro Focus Visual COBOL > Visual COBOL for Visual Studio 2012.
- Windows 8, 8.1, and Windows Server 2012
-
- From the Start screen, click the Visual COBOL for Visual Studio 2012 tile.
- Windows 10 and Later
-
- Click Start > Micro Focus Visual COBOL > Visual COBOL for Visual Studio 2012.
- When starting Visual Studio for the first time, you might be prompted to set the environment, depending on the Visual Studio
version which is installed.
If you are prompted, choose General development environment. In this setup Visual Studio is customized for work with COBOL projects.
The IDE is shown in the figure below, although the information displayed in the large pane will be different.
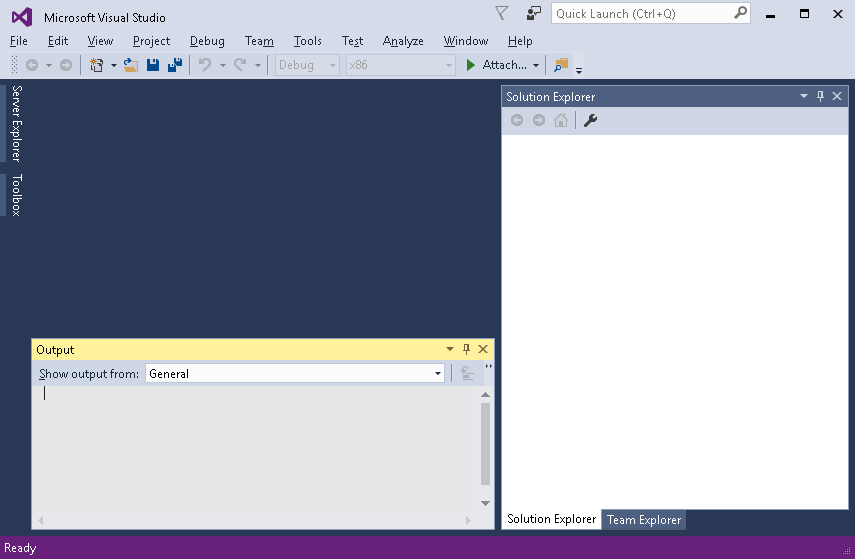
- The large pane is where your solutions and projects will be opened. At the moment, this shows the Start Page, with up-to-date information on Visual Studio. When you start work, this pane is where your code is displayed.
- The pane at the bottom is the Output window, where messages from the IDE and Compiler are displayed.
- The right pane is the Solution Explorer, which displays the structure of your solution and projects. At the bottom of the Solution Explorer pane are some tabs. Solution Explorer appears by default.
If any of these panes are hidden, you can show it from the View menu.
Creating a solution and a project
The first task is to create a solution and a project. A solution is a container holding one or more projects that work together to create an application. The solution has the extension .sln, and is a readable text file. Microsoft recommends you do not edit the file outside of Visual Studio.
A COBOL project has the extension .cblproj, and again this is a readable file, but Microsoft recommends that you do not edit it. Different types of project have different extensions, so for example a C# project has the extension .csproj.
To create a project and solution:
- In Visual Studio, clicking File > New > Project.
- In the New Project dialog, , expand Installed > Templates > COBOL and click Native.
- Select the Console Application template.
- In the
Name field, specify a name for the project such as
NativeApplication.
Notice that the Name and Solution name fields have the same name.
- In the
Location field, browse to a directory where you want to put this tutorial.
For example, if you create a folder on your c: drive called tutorials, change the location field to c:\tutorials. The solution will be stored in a subdirectory NativeApplication, according to the project name.
- Click OK.
This creates a solution and a project. The Solution Explorer shows the NativeApplication project. It contains:
- Program1.cbl - a newly created skeleton program.
- A Properties folder - displays the project's properties when you double-click it.
Edit the project
You now need to provide some sample code for the application that sets a pointer to the memory address of a variable.
- Double-click Program1.cbl in Solution Explorer to open the file for editing.
- Copy and paste the following code to replace the code that was added by the template:
program-id. Program1. working-storage section. 01 fred pic x(100) value "start". 01 fred-pointer pointer. procedure division. set fred-pointer to address of fred display "hello" move "testdata" to fred display "hello again" if fred = "middle" move "end" to fred end-if move "Richard Nixon" to fred display "fred contains " fred goback. end program Program1. - Click File > Save All.
- As further on, you are going to debug the project, you can now add some COBOL watchpoints for the data items in the code:
- Right-click fred in the editor.
- Click
Add COBOL Watchpoint.
This opens the Watchpoints window and adds the data item to it.
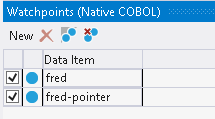
- Add fred-pointer to the Watchpoints window in the same way.
Building and running the application
There are two default build configurations for each project type: Debug and Release. These configurations define how to build the project for the different situations.
To build the project for debugging and to run it:
- Check the build configuration in use, by clicking Build > Configuration Manager.
- In
Active solution configuration, choose
Debug and click
Close.
Notice in the standard toolbar at the top of the IDE, that Debug shows as the active configuration.
- Build the project, by clicking
Build >
Build Solution.
The Build option builds only those files that have changed since they were last built, whereas the Rebuild option builds all the files in the project, regardless of whether they have changed since they were last built.
- Check that the project compiled successfully by looking in the
Output window.
If the window is not visible, to display it, click View > Output.
- Run the application, by clicking
Debug >
Start Without Debugging or
 .
.
A console window opens, showing the output from the execution of the sample application.
- Press any key to close the console.
Modifying the project's properties
A project's properties define characteristics of the project and enable you to control a project's behavior among other things. By default, each project template comes with a default set of predefined properties.
- To see a summary of the project properties, select the project or solution in the Solution Explorer. A default
Properties window is displayed below the Solution Explorer.
If the Properties window is not visible, you can show it by clicking View (> Other Windows) > Properties Window.
A description of the selected property is displayed dynamically at the bottom of the Properties window. To turn this description on and off, right-click in the description and uncheck Description in the context menu.
- To display the full project's properties, right-click the project in Solution Explorer and click Properties.
- Go to the
COBOL page of the properties, to display the selected properties for building the project. Notice that:
- Configuration is set to Active (Debug)
- Compile for debugging is checked
- COBOL dialect is set to Micro Focus
- Output path shows where the build files will be put
- Go to the Debug page and notice that Start project is checked, so that the application starts debugging in the current project.
- Browse the other properties pages to see what is available and what is set by default for a console application.
Debugging the project
The IDE provides debugging facilities, such as stepping, examining data item values and setting breakpoints. To see some of these facilities in action:
- Click
Debug >
Start Debugging.
Alternatively, you click
 , or press
F5.
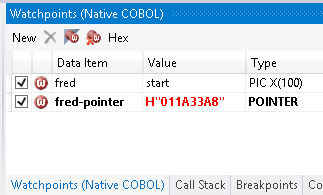
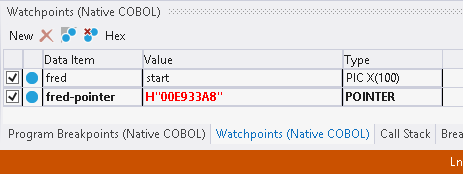
Visual Studio enters debug mode and stops on the line for display "hello". This is because you set watchpoints for the two variables in the program and the value of one of them, fred-pointer, has changed. The debugger breaks the execution and stops on the first line after the one on which the value of the data item changed.
Notice that the Watchpoints window indicates the change by emboldening the data item and highlighting the changed value in red:
- Click
Debug >
Step Into, or press
F11.
A console opens for running the built program. In the IDE, the first statement in the PROCEDURE DIVISION of the source code is highlighted and the cursor is positioned on it. This is the statement that will be executed next. The statement sets the pointer fred-pointer to the memory of address of the variable fred.
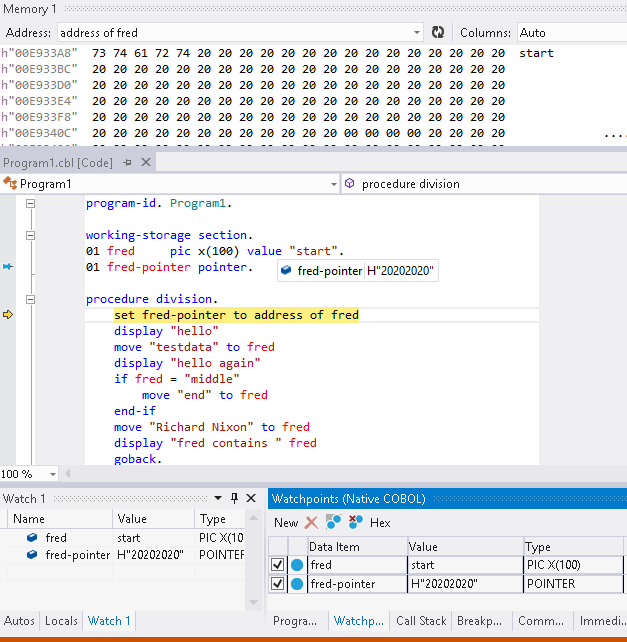
The IDE enables you to watch the memory and how the values of variables change during the execution of the program. The next steps describe how to enable the Memory and Watch windows, and add watches to the two variables.
- Click Debug > Windows > Memory > Memory 1 to open the Memory window.
- You will use the
Memory window to watch the memory address of the variable
fred. To do this, enter any of the following strings in the
Address field and press
Enter:
- address of fred - this locates the memory address of fred
- fred-pointer - same as above after the program sets this variable to point to the memory address of fred
- The HEX address of fred in the form of H"nnnnnnnn" - hover over fred-pointer to ascertain the value
- Click Debug > Windows > Watch > Watch 1 to display the Watch window.
- Add watches to
fred and
fred-pointer as follows:
- Right-click either one of the variables in the editor and choose Add Watch.
- Repeat the same for the other variable.
- Pin the DataTips for the two variables to the editor window as follows:
- In the editor, right-click either one of the variables and select Pin To Source.
- Repeat the same for the other variable.
- Click
Debug >
Step Into, or press
F11 to step into the first statement.
This sets the pointer fred-pointer to the memory address of fred. The value of fred-pointer changes and you can see the new one in the DataTip and in the Watch window. The new value is the HEX address of fred.
- Enter the HEX address in the Address field of the Memory window as H"nnnnnnnn" and press Enter.
- Continue stepping through the code and note how the memory at the specified address changes:

- If you want to edit the memory at the address of
fred, you can do this directly in the
Memory window:
- Right-click a number in the HEX view and click Edit Value.
- Enter a new HEX number and press
Enter.
Or,
- Click the data in the desired memory location in either the hexadecimal or character view to position the caret, and simply change its value. You can also use the keyboard arrow keys to position the caret.
- Continue stepping the program in the same way and watch how the values of the two variables change.
After you have finished debugging, you can close Visual Studio. You do not need to explicitly save anything, because the files are automatically saved when you build them.