Advanced Data Analytics

Multiple data analytics tools provide quick graphical analysis of stored data.

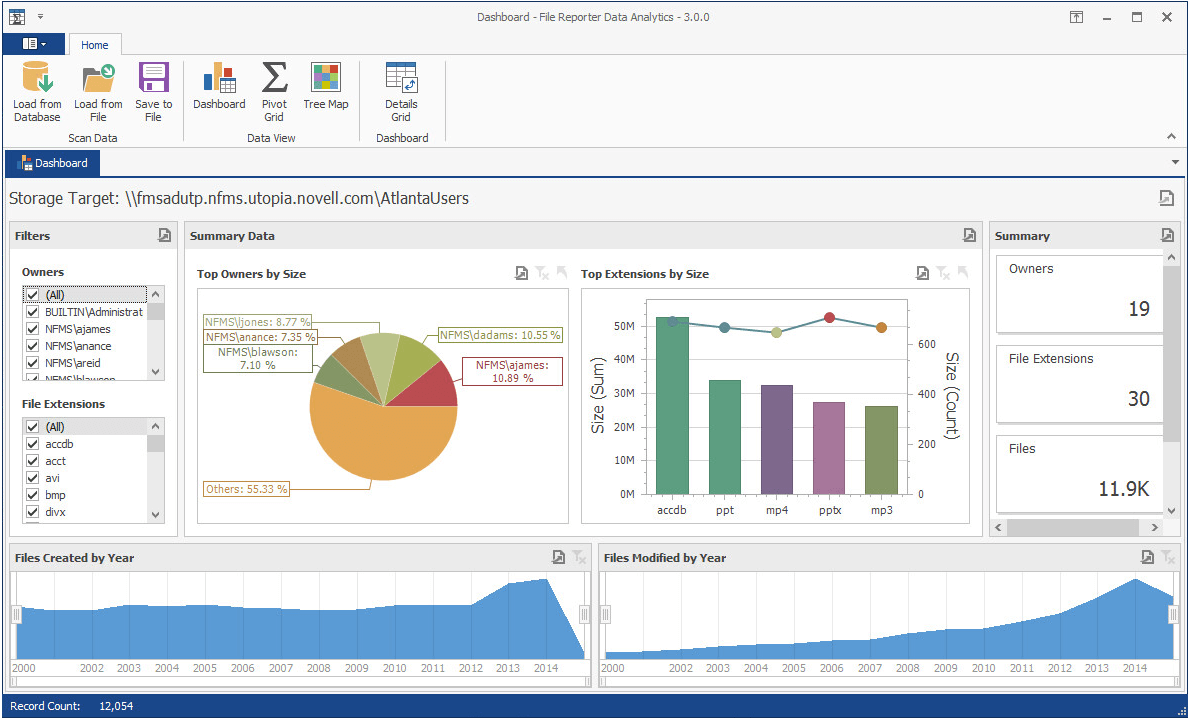
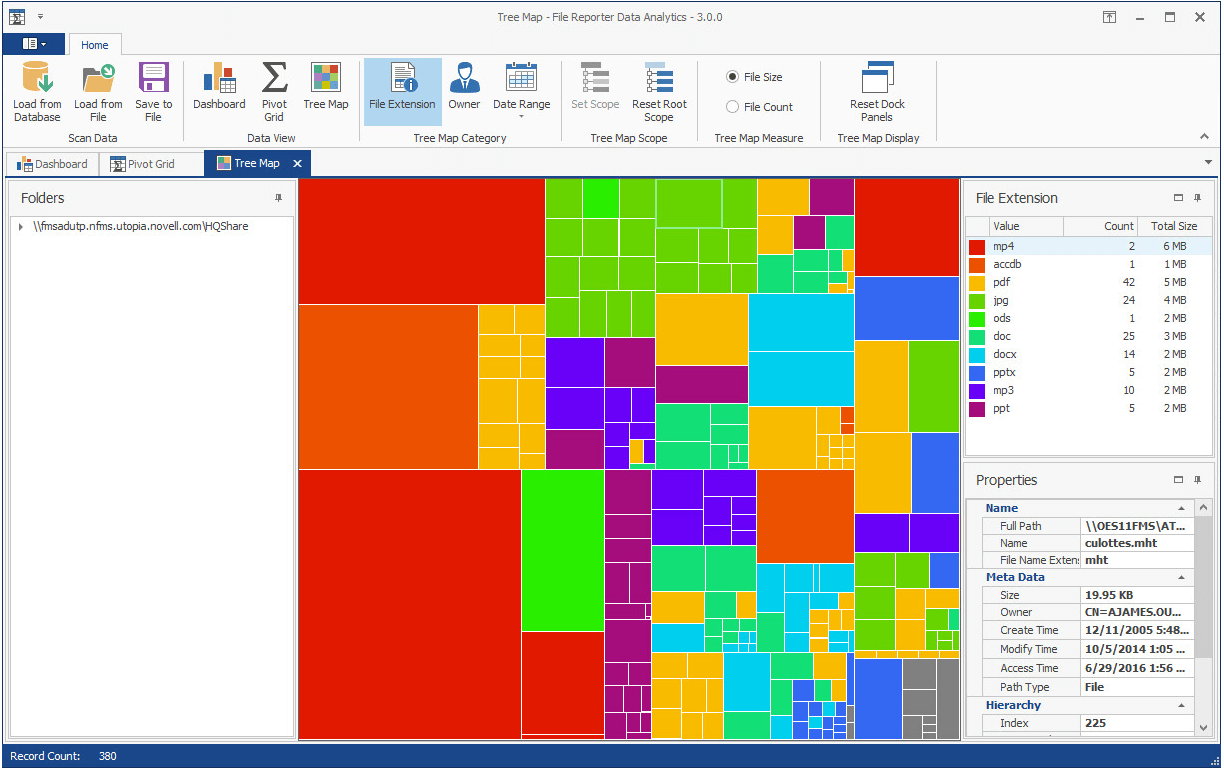
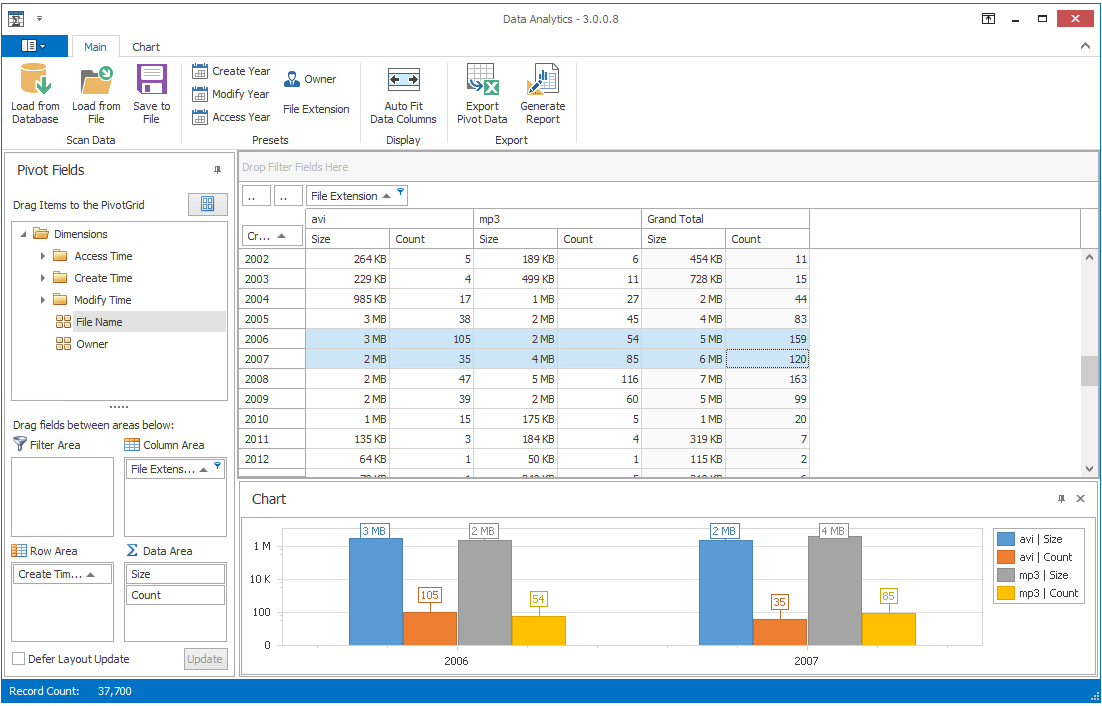
Despite the wealth of detailed information provided in the built-in and Custom Query reports, sometimes you need quick answers to questions such as “How relevant is the data on this storage device?” or “How can I present my findings more succinctly?” A great way to address these challenges is through File Reporter Data Analytics.

Dashboard

The Dashboard lets you analyze data content according to categories that you select. Drill-down capabilities let you analyze very specific file information and even access selected files for examination. Graphing capabilities let you generate file content specific graphs.

Advanced Data Analytics
Tree Map

The Tree Map is a visual means of displaying hierarchical data for file system storage and file system permissions. This 64-bit workstation application lets you quickly view and analyze file system data according to file extensions, owners, and age. New drill-down capabilities let you see, in a graphical sense, the contents of folders and subfolders.

Advanced Data Analytics
Pivot Grid

The Pivot Grid is a powerful means of analyzing data visually by taking the findings of file system scans, and presenting the data according to your wishes. Using the Pivot Grid, you can sort, total, average, create cross tabulations, etc., using a combination of fields and seeing the results immediately.

Advanced Data Analytics