2.0 Prometheus with Grafana Architecture
Figure 2-1 Prometheus with Grafana Architecture
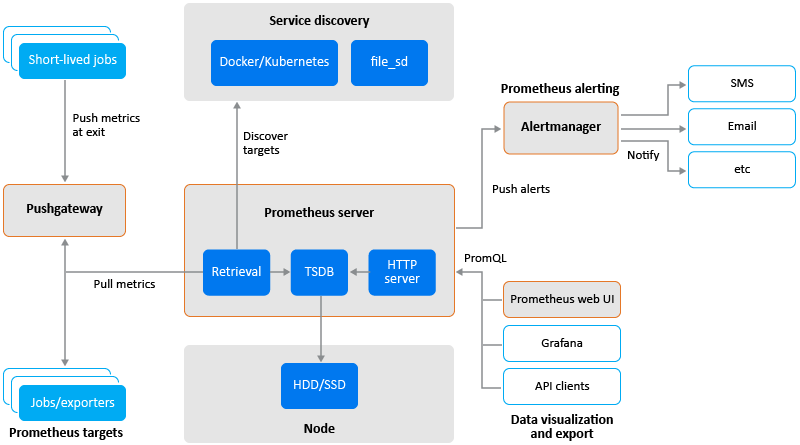
The Prometheus ecosystem consists of multiple components, many of which are optional:
-
the main Prometheus server which scrapes and stores time series data
-
client libraries for instrumenting application code
-
a push gateway for supporting short-lived jobs
-
special-purpose exporters for services like HAProxy, StatsD, Graphite, etc.
-
an alertmanager to handle alerts
-
various support tools
Prometheus scrapes metrics from instrumented jobs, either directly or via an intermediary push gateway for short-lived jobs. It stores all scraped samples locally and runs rules over this data to either aggregate and record new time series from existing data or generate alerts. Grafana or other API consumers can be used to visualize the collected data.
Prometheus has standard exporters (like node exporter) available to export metrics. An exporter acts like a proxy between the application and Prometheus. It receives requests from the Prometheus server, collect data from the access and error logs of the application, transform it into the correct format, and then sends the data back to the Prometheus server. See, Exporters and Integrationsin Prometheus documentation.
The Prometheus Node Exporter exposes a wide variety of hardware- and kernel-related metrics. See, Monitoring Linux Host Metrics with the Node Exporter in Prometheus documentation.
Prometheus collects data in the form of time series. The time series is built using a pull model at a specific polling frequency consisting of Prometheus server queries and exporters. Targets are discovered using service discovery or static configuration. Prometheus data is stored in the form of metrics, with each metric having a name that is used for referencing and querying it. Prometheus stores data locally on disk, which helps for fast data storage and fast querying but ability to store metrics in remote storage.
Each Prometheus server is standalone and does not rely on network storage or other external services.