Overview of Debugging in Visual Studio Code
Debugging in Visual Studio Code requires that you create a launch configuration with the settings which the debugger requires to enable it to debug your COBOL code. The following instructions demonstrate how to debug native COBOL code with the default launch configuration:
- Open the folder that contains your sources in Visual Studio Code.
- Ensure that the sources are compiled.
- Click (Run > Start Debugging).
This shows the Task Picker with the available debugging tasks:

- Select
COBOL (native): (native) from the drop-down list. This is the default task provided with the
Rocket COBOL extension for debugging native COBOL applications.
This creates a launch.json file in a .vscode subfolder in the folder that holds your sources. By default, the launch.json contains two configurations - one for debugging a standalone application, and one for attaching the debugger to a running process:
    "configurations": [
        {
            "type": "cobol",
            "request": "launch",
            "name": "COBOL (native): Launch",
            "program": "${workspaceFolder}/<insert-program-name-here>",
            "cwd": "${workspaceFolder}",
            "stopOnEntry": true
        },
        {
            "type": "cobol",
            "request": "attach",
            "name": "COBOL (native): Attach to process",
            "processId": "${command:pickProcess}"
        }
    ]
}
You can add more configurations to this file as required.
- In the Activity bar, click
 to open the Run panel.
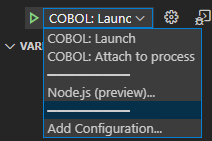
The two default launch configurations are listed in the Configuration drop-down within the Run panel:

- Select the launch configuration,
COBOL (native): Launch, and click
 (Start Debugging).

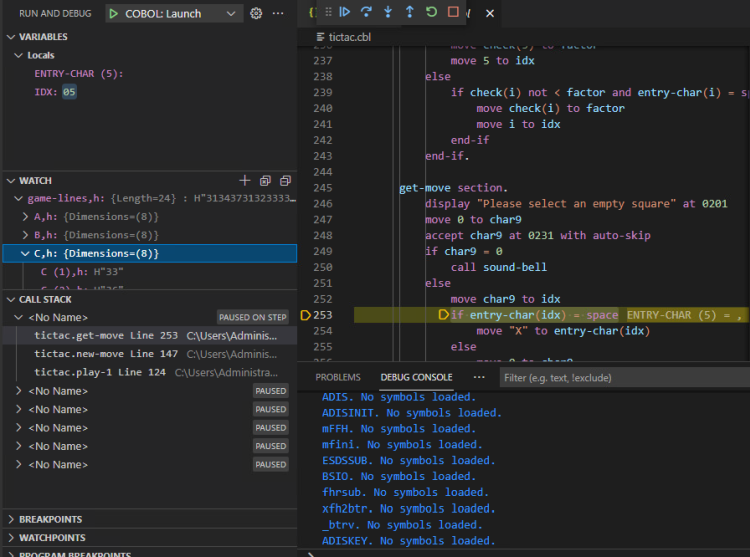
- Use the commands in the Debug widget to step through the code.

- Use the available views to watch how variables change.
- As you step through the code, the values of variables on the current line are shown inline in the editor, at the end of the
line:

You can control whether to display the inline values with the Microsoft Debug: Inline Values setting of Visual Studio Code.
- In the
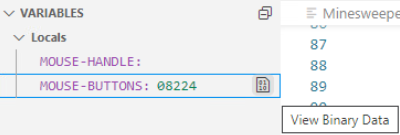
VARIABLES panel, click the
View Binary Data icon on a row for a variable.
This opens a Memory window that enables you to view and edit data in the memory associated with the selected item.
