Debugging
Important:
- This functionality requires a licensed version of a Rocket Visual COBOL or Rocket Enterprise Developer product on the same machine. See Installation for details.
- Visual Studio Code supports debugging of native COBOL code and for .NET Core COBOL projects created with Visual COBOL or Enterprise Developer for Visual Studio.
Debug features
Visual Studio Code provides the
DEBUG CONSOLE as well as a number of panels dedicated to debugging in the
Run view - click
 (Run).
- Breakpoints
- Add breakpoints by clicking in the editor margin. See the available breakpoints in the Breakpoints panel. You can set conditions such as expressions and hit counts for the breakpoints.
- Call stack panel
- Shows the stack frames for each thread. Double-click a stack frame to navigate to the source code.
- Debug widget
- Includes the debug actions.

- Variables panel
- Shows the values of items on the current statement.
- Watch view
- Enables you to add items to watch as you debug. To view the contents in hexadecimal, type
,h after the name of the item you want to watch.
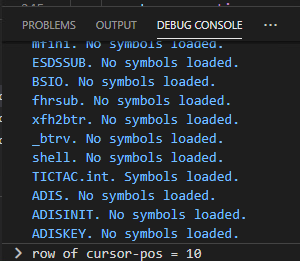
It is not possible to change the values of items directly in this panel. You can change the values by typing the command in the Debug Console REPL - for example:
